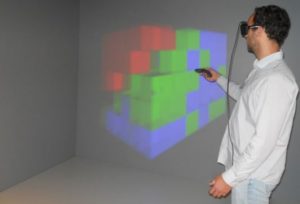


CAVE-SOM uses self organizing map dimensionality reduction to directly display the resulting 3D SOM inside a CAVE. Each neuron is represented by a cube where its position is determined by its position in the 3D SOM grid. The color is used to encode the category to compare, e.g. on the picture the Iris dataset was used each color encoding a type of flower, and the size represents the significance of the neuron. Moreover, connection between neurons can also be visualized through bars with variable width and transparency both related to the connection strengh.
Using a wand the user can select a neuron by raycasting and button press, resulting in a pop-up window providing all the detailled information of the neuron. Last, a 3D floating menu permits to show/hide the connection between neurons.