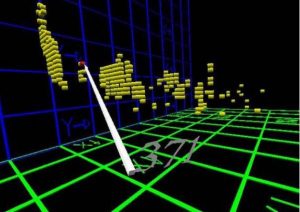
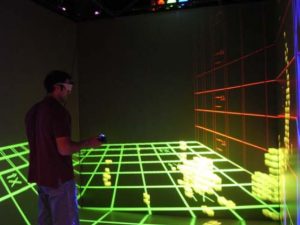

CaveDataView is used to analyze multi-dimensional data using a 3D scatterplot representation in a CAVE environment. Each axis of the cartesian coordinate system encode one attribute. Each datapoint is represented by a yellow cube, which turns red when selected using the wand. To do so, a raycast is emitted from the wand and the user must point towards the datapoint. Moreover, when a datapoint is selected, detailed information is provided via text placed on top of the wand.