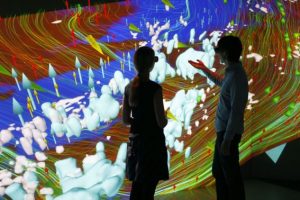
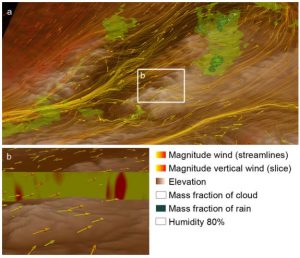
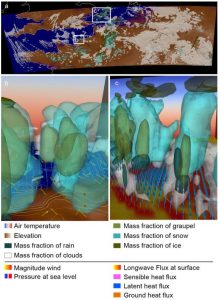
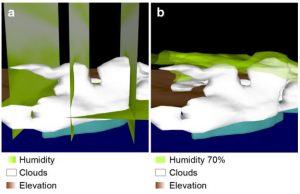

This immersive analytics system presents climate data from different compartment, i.e. atmosphere, surface, and soil, inside a CAVE. Data collected at specific weather station are represented by sphere where color and diameter encode the value of the sensor. 3D scalar data are represented through iso surfaces and iso volumes, e.g. surface temperature, while 3D vector data are represented by arrows and streamlines, e.g. ground heat flux. To encode additional attributes color, shape, and opacity of those elements are used. Color respects long established traditions to make it easier for the user to learn the visual mapping, e.g. water elements use a blue color, cloud mass a white color, and temperature gradient goes from blue to red.