
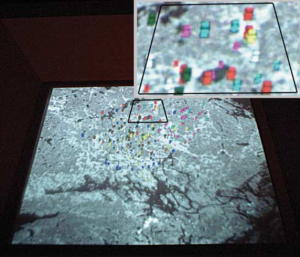
This system used disease occurrence data to help understanding the epidemic behaviour of multiple diseases. For each new appearance of sick people, a marker is placed on top of a 2D map at the location it occurred. The vertical axis is used to encode the occurrence time and the color of the marker the type of disease.