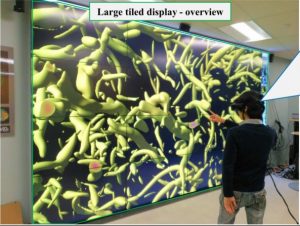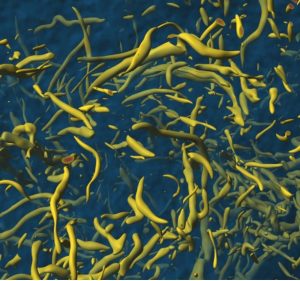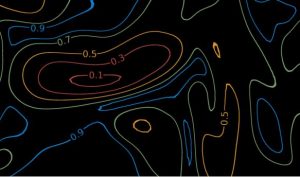


This immersive analytics system combines a wall display with an augmented reality headset to explore flow field data. 3D direct volume rendering technics are applied to generate the visualization extracted from the simulation. The main possibility of the system is to change on the fly the parameters of the simulation. However, computing the rendering for the full wall is a lengthy process, therefore the user can pre-visualize any change to the rendering through his AR headset cutting down the computation cost. Once, he is sure of the new selection for the parameters, confirmation is send and the computation for the full wall may starts.