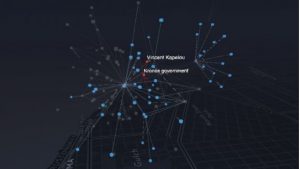
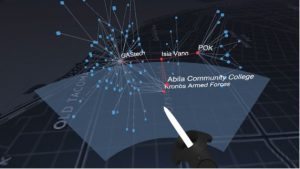

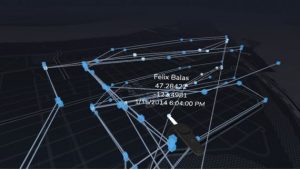
GeoVisor let data scientists explore multi-dimensional dataset by offering the possibility of multiple data visualization. Indeed, datapoint may be displaced as node-link diagram, topic clusters, parallel coordinate, or time series.
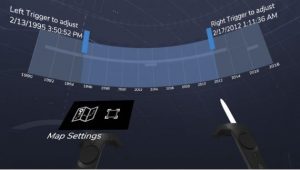
Interactions are made using the HTC Vive controllers, e.g. rotation and scaling of the visualization is done through the trackpad or selection of the time filter is done via a raycast from the controller that allow to grab the limits point via a trigger press. Moreover, datapoint can be selected and all visualization are linked, therefore a highlighted datapoint will remain highlighted in the other visualizations.