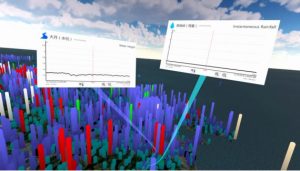
To support prevention of flood, this immersive analytics system proposes an immersive representation of data collected over 18.000 weather sensors all over Japan using a VR HMD. Each sensor is represented by an histogram placed on top of a 2D map of Japan where the height represent the precipitation value at the current timestep.
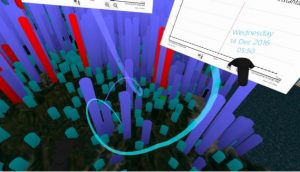
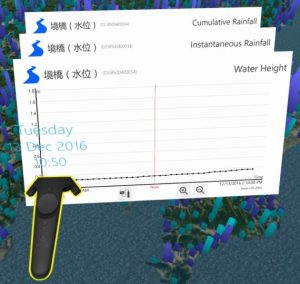
Using a VR controler, sensor can be selected using a raycast resulting in a pop-up window appearing containing a 2D scatterplot of the precipitation over time for this specific sensor. Those pop-up window can be grab and release at any position suiting the user, a link to the respective histogram is maintained at all time. The user may grab and launch the windows to close them, making them explode for more user engagement.