
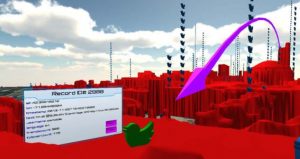
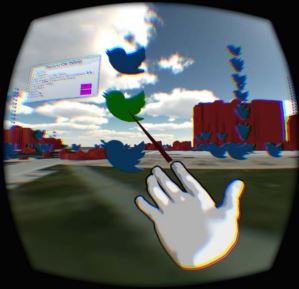
6.000 tweets from the MIT campus from October 2013 to February 2014 as been used as data input for this immersive analytics system. A 3D representation of the MIT campus from laser scanning serve as a base for the visualization. Tweets are located from where they are generated on a 2D level, if multiple tweet are at the same location they are just placed on top of each other on the Z axis. Tweets are 3D object with the shape of twitters logo, if a tweet failed to be loaded a red skull is shown in its place.
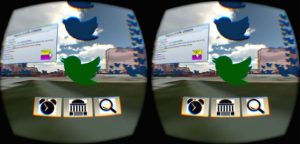
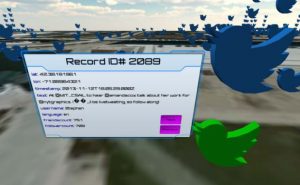
Interactions uses hand gesture capture with a LeapMotion. For instance, user can point at tweet to get the detailed information of it appearing in a pop-up window. Moreover, opacity of the building element can also be changed.