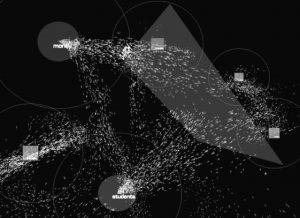
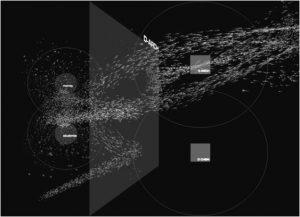


Infoticles comes from the contraction of information and particles. Indeed, the principle of this visualization is to represent each datapoint as a particle. Any table of the dataset can be added to the representation as a circle and will start pouring particle/information based on their temporal data.
The position of particle does not have a defined semantics, it is the user that can influence their position through the use of filters. Indeed, filters are represented as black square and they will apply a force on any particle respecting the filter condition. Therefore, particle may be affected by multiple filter, each applying a force to them. Position of filter are free and may be moved around using a wand letting the user build its own visualization space.