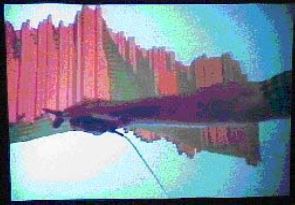
Helping analyst trader to discover market direction to ensure the best investment is the goal of this systems by providing visual access to stock market data over various time frame. Two representations are proposed, both encoding times and stock prices on two-axis, while the third one is used to either encode volume or moving average price over a period from 1 day to a full month.
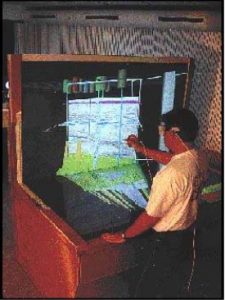
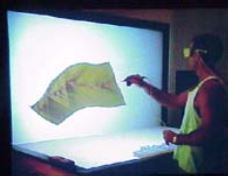
The system uses a workbench as display of choice. Interaction remains limited, the user may navigate the visualization by rotating it thanks to the use of a tracked stylus for instance.