
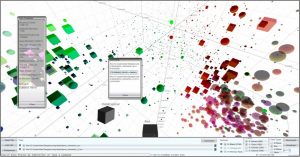
iViz proposed a 3D scatterplot representation to analyze multi-dimensional data. Each axis of the cartesian coordinate system encode one attribute of the dataset. Moreover, each property of the datapoints can be used to encode additional attributes, e.g. shape, color, sizes, transparency, and texture. The particularity of iViz is letting the freedom to change the whole mapping based on the user choice. Moreover, iViz work both inside a VR HMD and in a web browser.