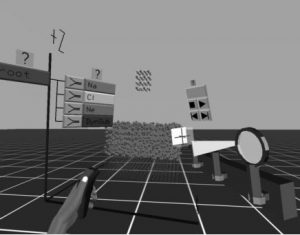
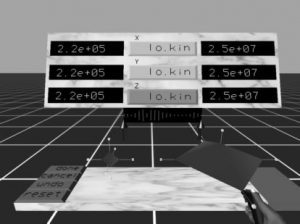
Using a VR HMD display, the Virtual Data Visualizer (VDV) allows user to visualize result of molecular dynamics simulations. The default representation positioned sphere, representing atoms, at their spatial coordinate computed by the simulation. However, each axis can be attributed a new attribute, such as temperatures, energy distributions or momentum field, through a virtual menu where selection is done with a raycast projected from a Wand.
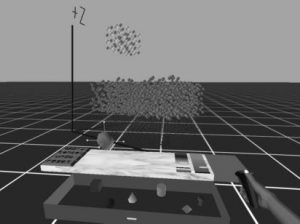
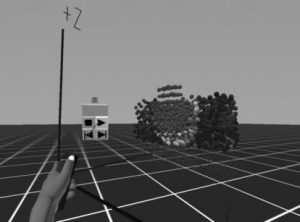
The particularity of the VDV is its interaction metaphor. Indeed, to filter data, a box selection virtual tool can be grabbed to be positioned and then rescaled to select a portion of the sphere. A magnifying glass virtual tool is used to zoom the visualization by pressing wand button while the tool is grabbed. Lastly, a workbench metaphor is presented to let user define its own 3D glyphs, shape can be extracted from a drawer, and size and color can be selected through contextual menu on top of the workbench. Then user can select a class of the dataset to apply this 3D glyphs to via the raycasting menu selection.