
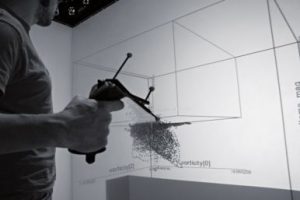

This immersive analytics system represents multiple 3D scatterplot, each using a different combination of attribute on the 3 axis. The particularity lies in the fact that those view are linked. Therefore the user can perform a selection in one of the view, through a box selection, i.e. using a wand to create the diagonal of the cube, to effectively highlight in all view the datapoint selected by the box selection. Multiple box selection can be done and in multiple view allowings user to perform more complex query.