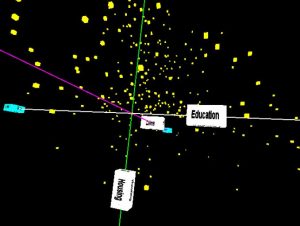
The Wizard system used a HMD to visualize multi-dimensional data in the form of a 3D scatterplot. The dataset explored is a data collection from over 350 US cities capturing numerical attributes such as average cost of housing, crime rate or education rate. Each city is represented by a yellow cube, positioned based on the value of the three attributes selected to represent the axes. The user being fully immersed in the scatterplot a small miniature of the visualization is attached to his hand to always know his position and have an overview of the full visualization.
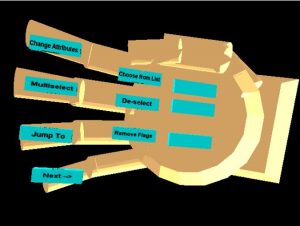
One particularity is the user can grab a “doll” in the mini map via a pinch gesture of his dataglove and move it, upon release the user will be teleported to the chosen destination in the mini-map. Moreover, selection if the link between attributes and axes can be done inside the virtual environment. A menu is displayed on the user hand in a “Tulip” manner to perform this selection, using the thumb to press the phalanges to confirm button selection.